
 |
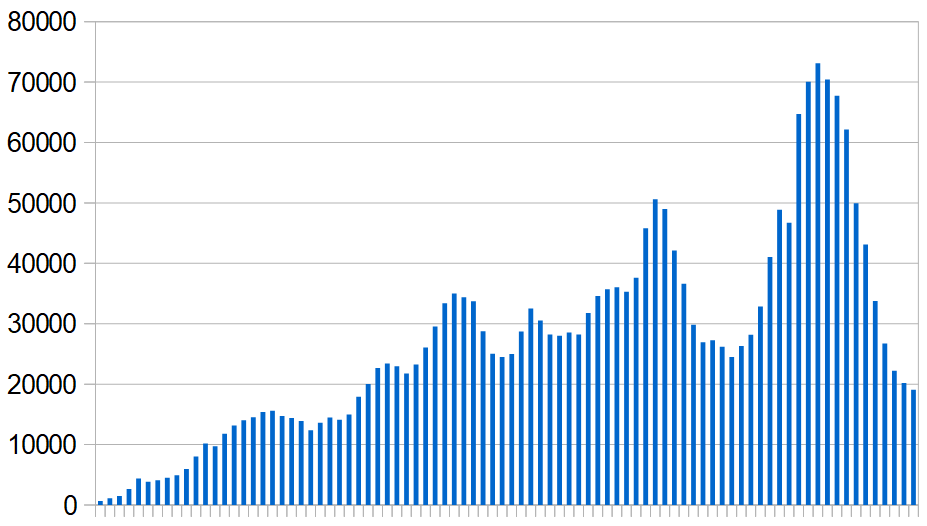
New Covid-19 cases recorded in the Middle East and North Africa averaged 19,075 a day during the past week. This is the first time since September last year that the daily average among the 20 countries monitored has dropped below 20,000.
New infections peaked in mid-August when the daily average topped 73,000, according to official figures. Since then, though, numbers have fallen every week.
Deaths attributed to Covid-19 are showing a similar decline. The highest weekly death toll – 7,264 – was at the end of August but it has dropped steadily since, with 2,483 recorded during the past week. This is the lowest number since the last week of February.
The reliability of official figures varies from country to country – some do a lot more testing than others – but the overall downward trend over the last 10 weeks has been remarkably consistent.
A large part of this improvement is due to lower numbers from Iran which has been the worst-affected country in the Middle East since the pandemic began. It accounts for more than a third of recorded infections in the region and 45% of related deaths.
However, other countries with smaller outbreaks have seen large reductions in new cases too. Morocco, Tunisia, Oman, Saudi Arabia, Kuwait, the UAE and Algeria have all reported drops of more than 90% since mid-August.
During the same period Egypt, Jordan, Palestine, Sudan, Syria and Yemen have reported increases, though the numbers are relatively low.
Seven-day average of new Covid-19 infections
| Country | Now | August | Change |
|
Algeria TOTAL |
82 19,074 |
955 73,107 |
-873 -54,033 |
See spreadsheet for detailed statistics of cases and deaths in the region since the beginning of the pandemic. Previous reports on how Covid-19 is affecting the region can be found here.